What is the problem?
On my new project I’ve investigated a bug in C++ code introduced by myself. This bug was related to some geometry manipulations, what means I was forced to deal with a lot’s of 2D points. The biggest problem with points, it’s difficult to understand anything by looking on their representation in the memory:
contours = size=9 {
  [0] = size=32 {
    [0] = (first = 394.10559999999998, second = 770.42160000000001)
    [1] = (first = 394.10559999999998, second = 770.42160000000001)
    [2] = (first = 393.29910558156649, second = 768.74409170725824)
    [3] = (first = 393.29910558156649, second = 768.74409170725824)
    [4] = (first = 393.93283799752811, second = 766.09207497414911)
    [5] = (first = 393.93283799752811, second = 766.09207497414911)
    [6] = (first = 394.476, second = 765.5163)
    [7] = (first = 394.476, second = 765.5163)
    ...
(Not very representative)
Before this time I’ve known about only two way of debugging C++ code: std::cout << "VAL: " << value << std::endl; and gdb.
Using both this methods I can’t actually see visible picture of what’s going on. I didn’t also want to bring new dependencies into our project just for debugging purposes. Spent some time looking for other options, I’ve found LLDB and it’s awesome Python scripting ability.
Why is it interesting? Showcase
Imagine, you can inspect all data available in run-time in your C++ code and you can manipulate it with whole python’s ecosystem.
Let me show.
First of all you need to have installed clang and lldb. On ubuntu you can easily get it here.
As with GCC, you should compile you could with debug output but using clang as a compiler. For example for CMake project you can do
$ export CXX=/usr/bin/clang++-8
$ export CC=/usr/bin/clang-8
$ cmake -DCMAKE_CXX_FLAGS="-g" ...
Cool! Now we can start debugging our binary file:
$ lldb <path_to_binary_file>
(lldb) target create "test"
Current executable set to 'tests' (x86_64).
(lldb)
lldb has very a similar interface with gdb. For the reference you cad read this manual. Let’s set a breakpoint and get into the place where we have available data to plot.
(lldb) b Test.cpp:42
(lldb) r # same interface as in GDB
And dive into python:
(lldb) script
Python Interactive Interpreter. To exit, type 'quit()', 'exit()' or Ctrl-D.
>>> import sys
>>>
>>> print(sys.version_info)
>>> sys.version_info(major=2, minor=7, micro=17, releaselevel='final', serial=0)
>>>
>>> print(sys.executable)
>>> /usr/bin/python
Amazing, now we have unfortunately python2.7’s interactive shell!
To have a reach python shell I’ll also install IPython.
In order to do not mess all python’s versions on my system I will directly use python’s executable that I obtain from previous command:
$ /usr/bin/python -m pip install ipython
And let’s also install numpy and matplotlib:
$ /usr/bin/python -m pip install numpy matplotlib
Cool! Now return back to our python shell in lldb. Since we have installed IPython we can run:
>>> from IPython import embed; embed()
>>> Python 2.7.17 (default, Apr 15 2020, 17:20:14)
Type "copyright", "credits" or "license" for more information.

IPython 5.10.0 -- An enhanced Interactive Python.
?         -> Introduction and overview of IPython's features.
%quickref -> Quick reference.
help      -> Python's own help system.
object?   -> Details about 'object', use 'object??' for extra details.
/home/szobov/.local/lib/python2.7/site-packages/IPython/terminal/embed.py:285: UserWarning: Failed to get module unknown module
  global_ns.get('__name__', 'unknown module')

In [1]:
Super! Now we can access every variable, that was accessible in lldb.
In my example I have class instance with current_contour_ member, containing vector of 2D points. Let’s see how it looks:
In [1]: In [1]: import matplotlib.pyplot as plt

In [2]: plt.figure()
Out[2]: <Figure size 640x480 with 0 Axes>

In [3]: inst = lldb.frame.FindVariable("this")

In [4]: cc = inst.GetChildMemberWithName("current_contour_")

In [5]: points_x = []; points_y = []

In [6]: for point in cc.children:
   ...:     points_x.append(float(point.GetChildMemberWithName("first").GetValue()))
   ...:     points_y.append(float(point.GetChildMemberWithName("second").GetValue()))
   ...:

In [7]: plt.plot(points_x, points_y)
Out[7]: [<matplotlib.lines.Line2D at 0x7fc185950450>]

In [8]: plt.show()
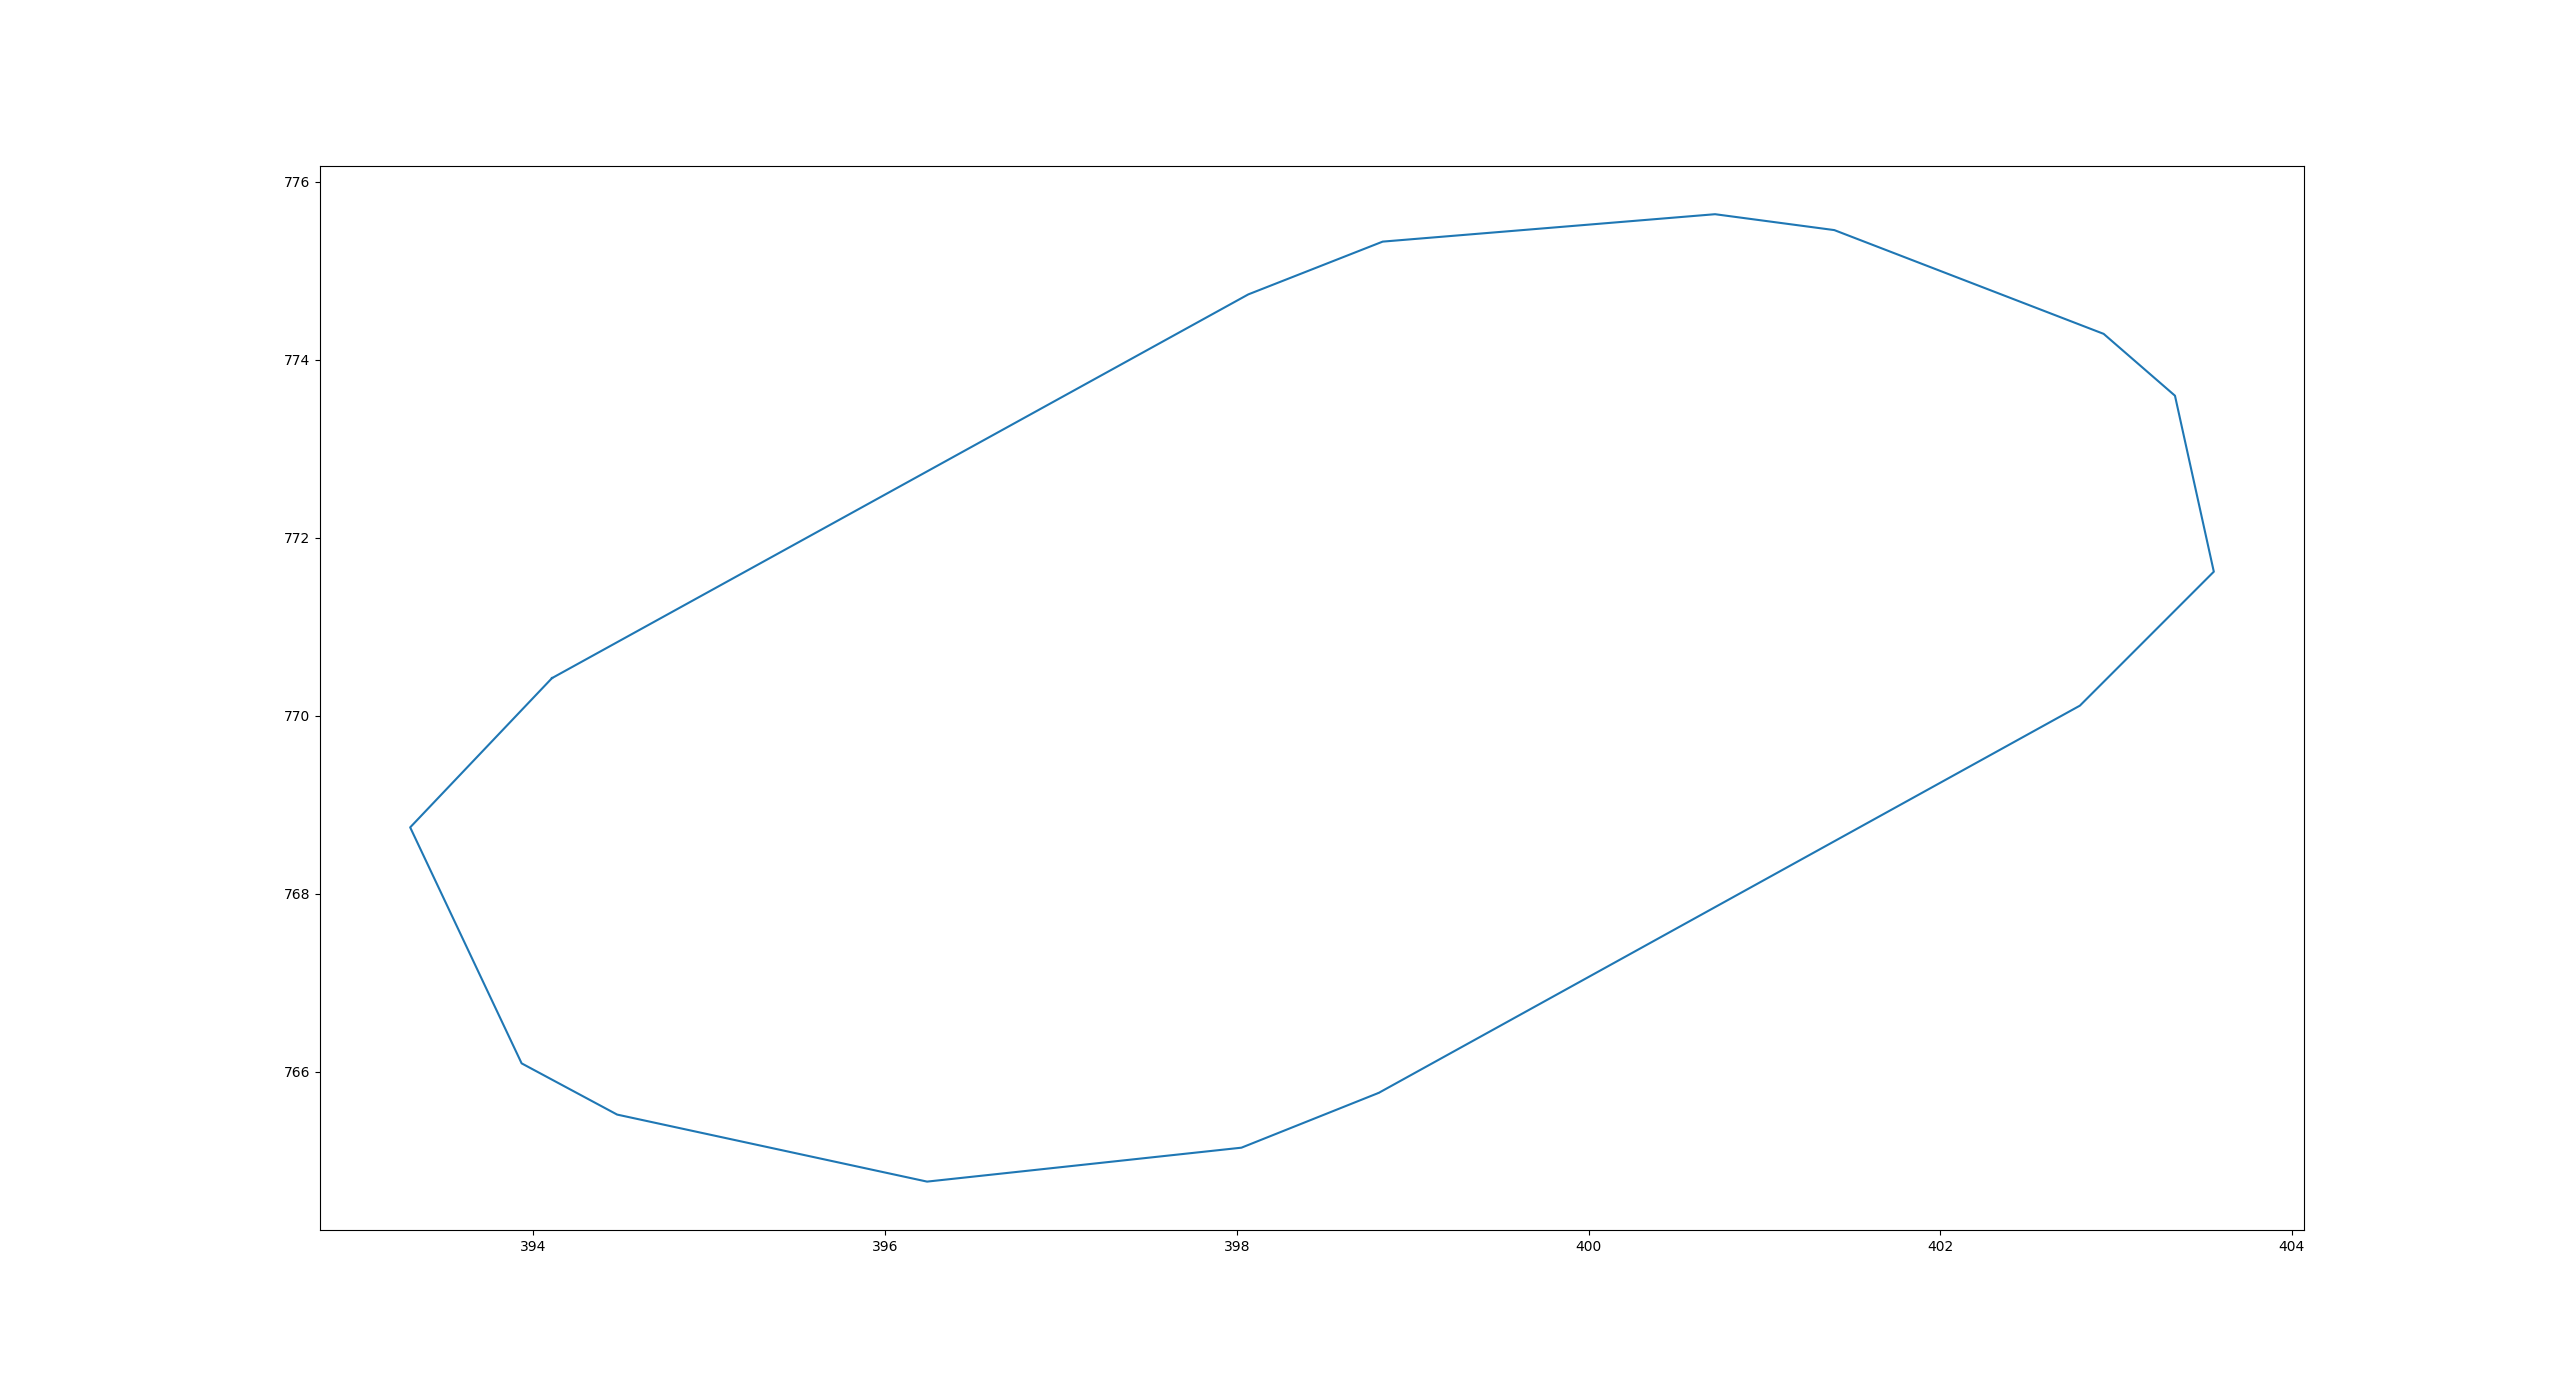
Wow! It works!
But what we are actually doing here? Of course the most interesting part is here:
inst = lldb.frame.FindVariable("this")
Every variable, that you can access in the current stack frame is accessible via lldb.frame.FindVariable.
We can also print the value of this variable, but be sure you are using print() function:
In [12]: cc
Out[12]: <lldb.SBValue; proxy of <Swig Object of type 'lldb::SBValue *' at 0x7fc1d4784d50> >

In [13]: print(cc)
(Contour) current_contour_ = size=32 {
  [0] = (first = 394.10559999999998, second = 770.42160000000001)
  [1] = (first = 394.10559999999998, second = 770.42160000000001)
  [2] = (first = 393.29910558156649, second = 768.74409170725824)
  [3] = (first = 393.29910558156649, second = 768.74409170725824)
  [4] = (first = 393.93283799752811, second = 766.09207497414911)
  [5] = (first = 393.93283799752811, second = 766.09207497414911)
  [6] = (first = 394.476, second = 765.5163)
  [7] = (first = 394.476, second = 765.5163)
  [8] = (first = 396.23839621506357, second = 764.76305816939089)
  [9] = (first = 396.23839621506357, second = 764.76305816939089)
  [10] = (first = 398.02625873303737, second = 765.14434940609226)
  [11] = (first = 398.02625873303737, second = 765.14434940609226)
  [12] = (first = 398.80720000000002, second = 765.76059999999995)
  [13] = (first = 398.80720000000002, second = 765.76060000000007)
  [14] = (first = 402.79422234237865, second = 770.11214483278968)
  [15] = (first = 402.79422234237865, second = 770.11214483278968)
  [16] = (first = 403.5557886638382, second = 771.61769280081421)
  [17] = (first = 403.5557886638382, second = 771.61769280081421)
  [18] = (first = 403.33485282051925, second = 773.59543664282614)
  [19] = (first = 403.33485282051925, second = 773.59543664282614)
  [20] = (first = 402.92930000000001, second = 774.29039999999998)
  [21] = (first = 402.92930000000001, second = 774.29039999999998)
  [22] = (first = 401.39770218822713, second = 775.45647424106039)
  [23] = (first = 401.39770218822713, second = 775.45647424106039)
  [24] = (first = 400.71949999999998, second = 775.63499999999999)
  [25] = (first = 400.71949999999998, second = 775.63499999999999)
  [26] = (first = 398.82940125651214, second = 775.32698997063551)
  [27] = (first = 398.82940125651214, second = 775.32698997063551)
  [28] = (first = 398.06510000000003, second = 774.73380000000009)
  [29] = (first = 398.06510000000003, second = 774.73380000000009)
  [30] = (first = 394.10559999999998, second = 770.42160000000001)
  [31] = (first = 394.10559999999998, second = 770.42160000000001)
}
You can also look on all available variables in the current stack frame:
In [15]: print(lldb.frame.variables)
(ContourProcessor *) this = 0x00007fffffffa6a8
(std::pair<double, double>) current_start = (first = 6.9533558065286948E-310, second = 0.000000000000000000000000000000000000000000000000000000000000000000000000000017272337139314744)
(std::pair<double, double>) current_end = (first = 1.6798231958602383E-322, second = 1.6798231958602383E-322)
(std::ios_base::Init) std::__ioinit = {}
And you can loop over all class members and access them:
In [26]: for c in inst.children: print(c)
(std::vector<std::vector<std::pair<double, double>, std::allocator<std::pair<double, double> > >, std::allocator<std::vector<std::pair<double, double>, std::allocator<std::pair<double, double> > > > >) contours_ = size=0 {}
(std::vector<std::vector<std::pair<double, double>, std::allocator<std::pair<double, double> > >, std::allocator<std::vector<std::pair<double, double>, std::allocator<std::pair<double, double> > > > >) partial_contours_ = size=0 {}
(Contour) current_contour_ = size=32 {
  [0] = (first = 394.10559999999998, second = 770.42160000000001)
  [1] = (first = 394.10559999999998, second = 770.42160000000001)
  [2] = (first = 393.29910558156649, second = 768.74409170725824)
  [3] = (first = 393.29910558156649, second = 768.74409170725824)
  [4] = (first = 393.93283799752811, second = 766.09207497414911)
  [5] = (first = 393.93283799752811, second = 766.09207497414911)
  [6] = (first = 394.476, second = 765.5163)
  [7] = (first = 394.476, second = 765.5163)
  [8] = (first = 396.23839621506357, second = 764.76305816939089)
  [9] = (first = 396.23839621506357, second = 764.76305816939089)
  [10] = (first = 398.02625873303737, second = 765.14434940609226)
  [11] = (first = 398.02625873303737, second = 765.14434940609226)
  [12] = (first = 398.80720000000002, second = 765.76059999999995)
  [13] = (first = 398.80720000000002, second = 765.76060000000007)
  [14] = (first = 402.79422234237865, second = 770.11214483278968)
  [15] = (first = 402.79422234237865, second = 770.11214483278968)
  [16] = (first = 403.5557886638382, second = 771.61769280081421)
  [17] = (first = 403.5557886638382, second = 771.61769280081421)
  [18] = (first = 403.33485282051925, second = 773.59543664282614)
  [19] = (first = 403.33485282051925, second = 773.59543664282614)
  [20] = (first = 402.92930000000001, second = 774.29039999999998)
  [21] = (first = 402.92930000000001, second = 774.29039999999998)
  [22] = (first = 401.39770218822713, second = 775.45647424106039)
  [23] = (first = 401.39770218822713, second = 775.45647424106039)
  [24] = (first = 400.71949999999998, second = 775.63499999999999)
  [25] = (first = 400.71949999999998, second = 775.63499999999999)
  [26] = (first = 398.82940125651214, second = 775.32698997063551)
  [27] = (first = 398.82940125651214, second = 775.32698997063551)
  [28] = (first = 398.06510000000003, second = 774.73380000000009)
  [29] = (first = 398.06510000000003, second = 774.73380000000009)
  [30] = (first = 394.10559999999998, second = 770.42160000000001)
  [31] = (first = 394.10559999999998, second = 770.42160000000001)
}
(double) curr_x_ = 39410.559999999998
(double) curr_y_ = 77042.160000000003
(bool) pos_abs_ = true
(bool) pen_down_ = true

In [27]: cc = inst.GetChildMemberWithName("current_contour_")
An iteration over an iterable object like vector can be easily done with a for loop:
In [60]: for point in cc.children:
   ...:     points_x.append(float(point.GetChildMemberWithName("first").GetValue()))
   ...:     points_y.append(float(point.GetChildMemberWithName("second").GetValue()))

In [61]: print(cc.GetChildAtIndex(7))
(std::pair<double, double>) [7] = (first = 394.476, second = 765.5163)
It’s possible to also evaluate any expressions. Unfortunately, it’s not so convenient as is lldb, because it doesn’t provide autocompletion, but still very useful when you need to check something right now:
In [61]: print(lldb.frame.EvaluateExpression("arePointsClose(current_start, current_end)"))
(bool) $0 = true
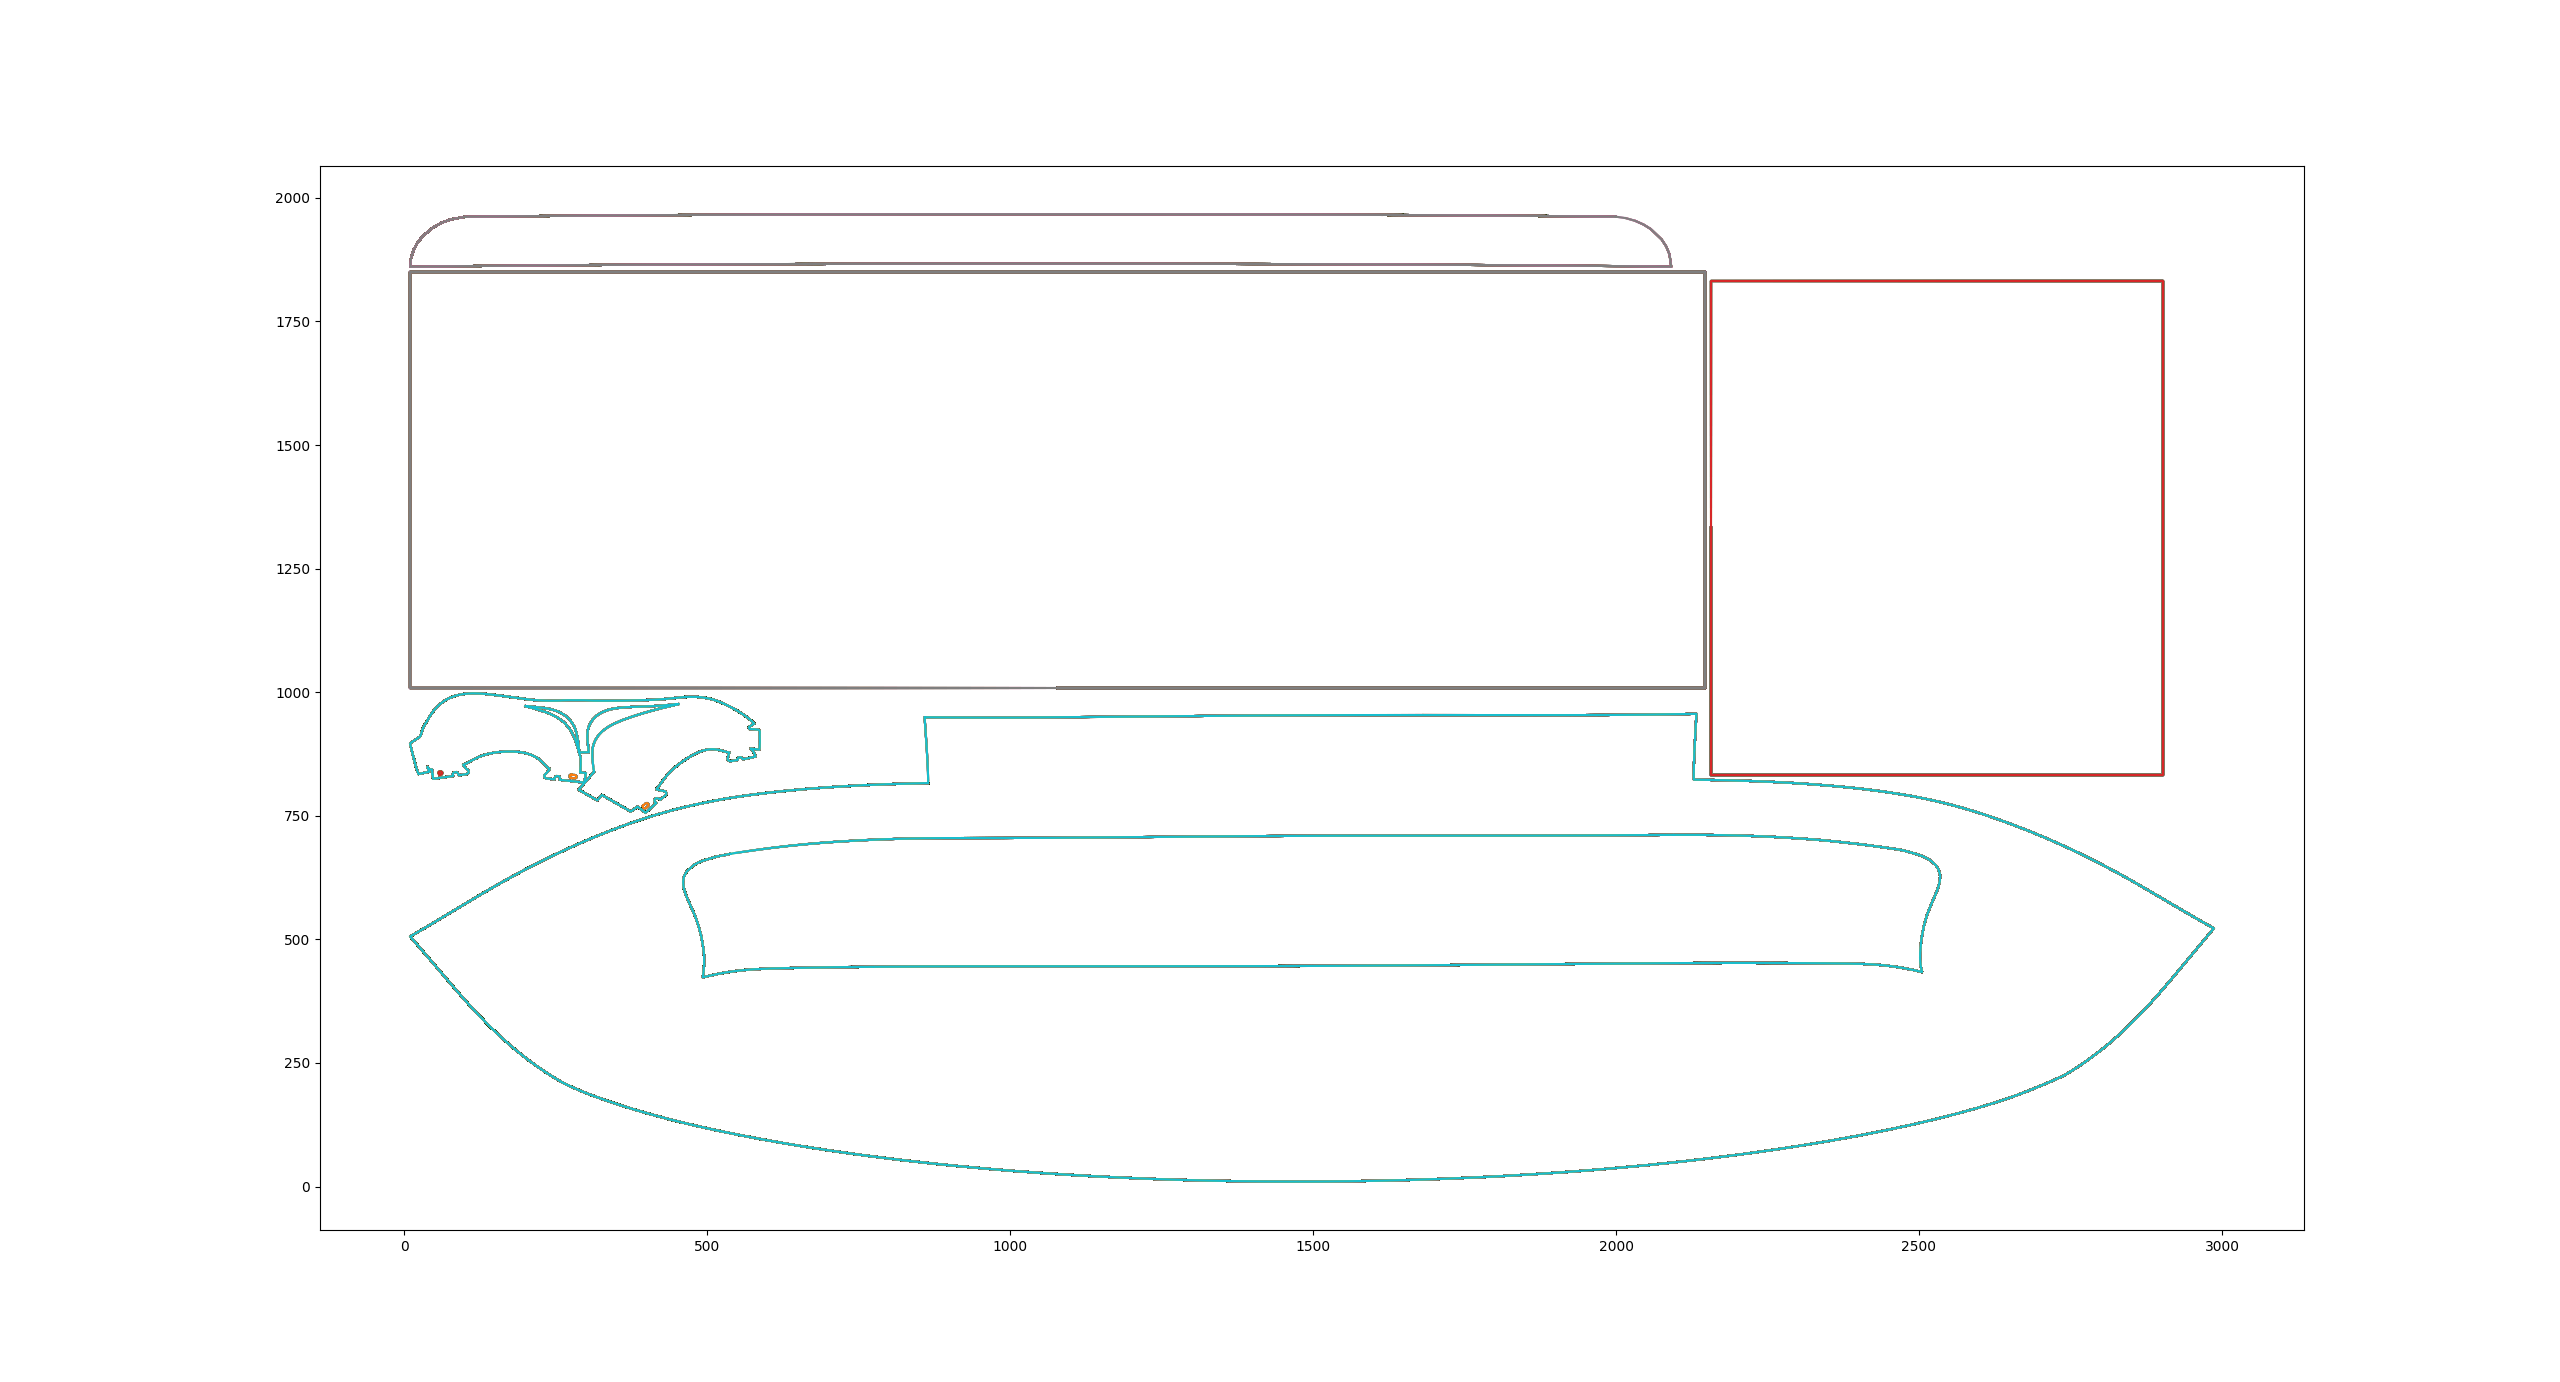
And for last example I want to show you how was it easy to plot many contours:
In [1]: contours = lldb.frame.FindVariable("contours")
In [2]: for contour in contours.children:
   ...:     x_points = []
   ...:     y_points = []
   ...:     for point in contour.children:
   ...:         x_points.append(float(point.GetChildMemberWithName("first").GetValue()))
   ...:         y_points.append(float(point.GetChildMemberWithName("second").GetValue()))
   ...:         plt.plot(x_points, y_points)

In [4]: plt.show()
In order to use your custom python scripts you can just add it to the $PYTHONPATH and it will be also accessible in this python shell.
So that’s it. Now you know how it is easy to use very powerful tool lldb debugging you C++ code with python.
For more information you can read LLDB’s manual.